

SOFTWARE
IDFix
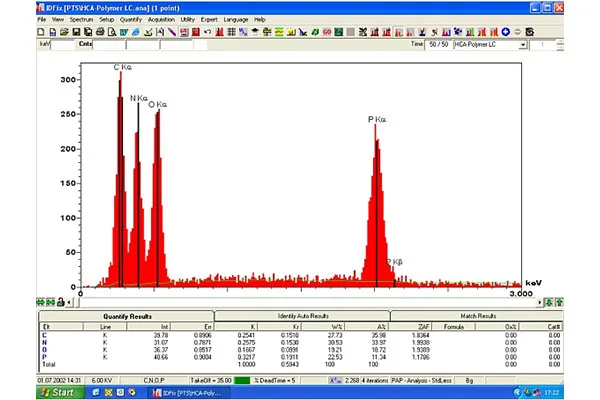
Specifications
- Automatic and manual element identification
- Easy to use, clearly structured, and enables fast results
- Analysis with and without standard or pseudo-standard
- XPP, PAP, and ZAF correction methods
- Consideration of coatings
- Stoichiometric analysis
- Quantitative analysis for TEM
- Quantitative live analysis
- Automatic HTML and Word report
- Spectrum can be saved in WMF format
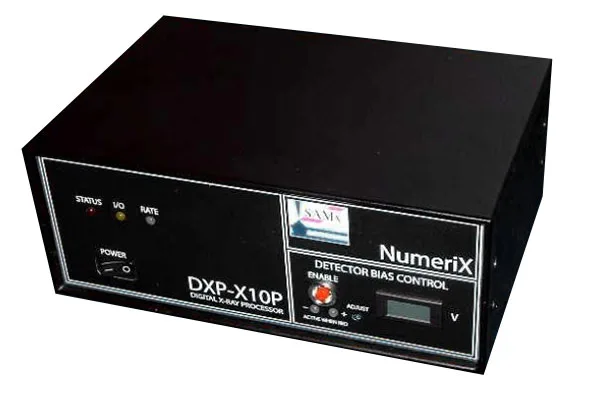
IDFix spectrum acquisition is based on the NumeriX digital pulse processor with 8192 channels. IDFix includes a software and hardware interface to the MaxView, HiMax, and DISS5 programs for qualitative and quantitative distribution images and line scans.
IDFix – Report
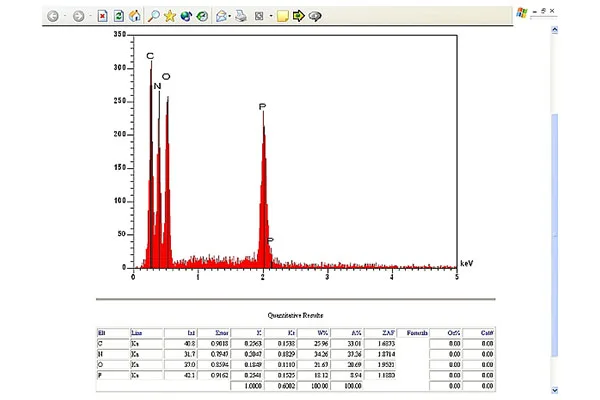
Figure shows HTML report
Figure shows Word report
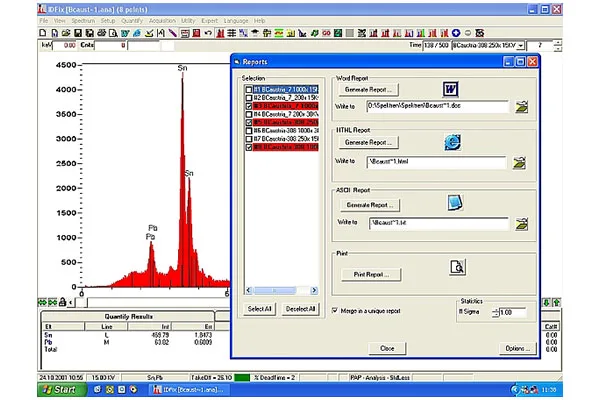
Figure shows multi-report
The various documentation options allow for a quick and clear printout or the creation of a detailed Word report. Furthermore, data can be saved as ASCII files or in HTML format (see Figure 1). Spectra and associated quantitative evaluations can be printed directly from the program. Using a hot key, the displayed Word report (see Figure 2) is generated; each user can customise it to their own requirements.
The multi-report (see Figure 3) is created individually; detailed Word report, ASCII, or HTML options are also available.
IDFix – NumeriX
Specifications
- Digital pulse processor system including the 8192-channel multichannel analyser, plus voltage and high-voltage supply for the EDX detector
- Processing of high count rates with acceptable dead times
- Compatible with almost all EDX detectors
- Suitable for upgrading older EDX systems
STRATAGem – The ultimate thin-film analysis program
Specifications
- Calculation of layer thicknesses and their composition (one or more layers can be calculated)
- Calculation of the substrate composition
- Measurement of the intensity ratio between unknown layer thicknesses and a standard (EDX or WDX)
- Direct import of measured values (Ix/Istd) for one or more acceleration voltages into the program
STRATAGem – Calculation of the following graphs
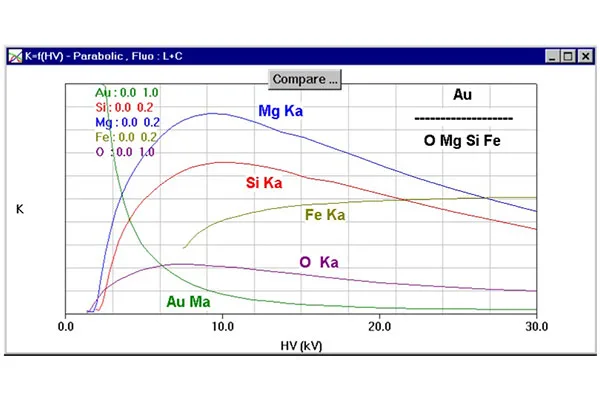
Figure shows intensity versus acceleration voltage
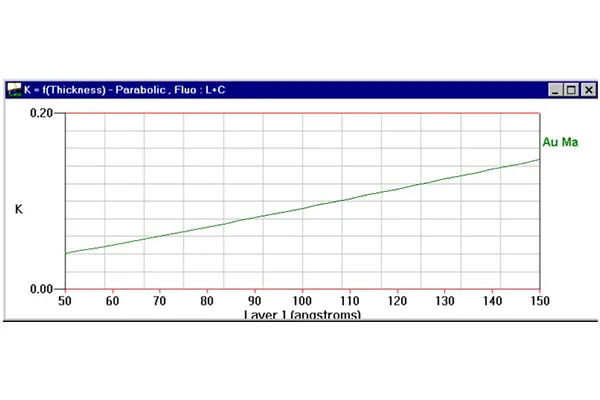
Figure shows intensity versus maximum ionisation potential
Figure shows intensity versus layer thickness
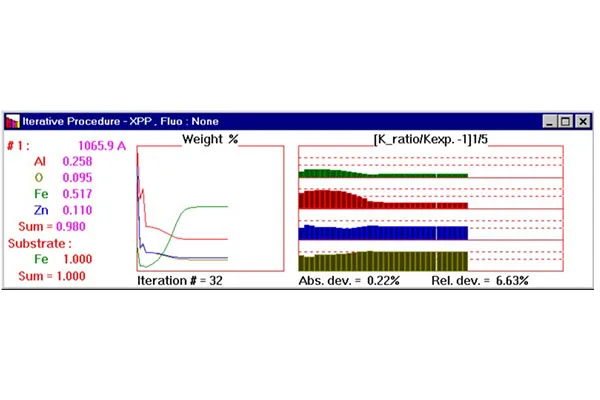
Figure shows iteration steps with associated error information
STRATAGem can include two X-ray lines per element in the calculation. The lower-energy line is used to calculate the composition of the top layer; the higher-energy line is used to determine the layer thickness. It is also possible to use different standards at different acceleration voltages for an element.
DISS5 – The active image acquisition and image processing system
Suitable for
- Scanning electron microscopes
- Scanning transmission electron microscopes
- Electron beam microprobes and ion probes
Image acquisition specifications
- USB 2.0 interface for command and data transfer
- Drivers for Windows 7 through Windows 11
- Active scan generator
- Maximum 16,483 x 16,483 pixels, free image format
- 4 x 12-bit D/A converters for analog image signals
- 12 x 16-bit counters for mapping
- Live image at 15 frames/sec. at 512 x 512 pixels
- Simultaneous acquisition of all image signals
- Up to 32,000x oversampling for noise-free images
- Line averaging and frame averaging
- Reduced-area scan with zoom function for focusing and astigmatism correction
- Entire system software-calibrated for each SEM
- Trigger inputs and clock outputs for point, line, and image
- Slow-scan synchronization to mains frequency
- Signal monitor for monitoring image signals
Image processing specifications
- Compatible with Windows 7 through Windows 11
- Image browser
- Open TIFF and bitmap image formats
- Save TIFF, bitmap, and JPEG image formats
- Save image data, calibration, point, and line-scan data in the image
- Auto-save function
- Layout function for recording and saving related images
- Print individual images or layouts at different zoom levels
- Crop image sections
- Measurement function for lengths, angles, and radii
- Image annotations
- Configurable image caption with micron marker and parameters
- False-color image display and image blending function
- Brightness, contrast, histogram function, and configurable matrix filter
- Context-sensitive online help
- Optional equidensity display with area proportion determination
Data export of point and line-scan data; measurement data as xls, html, and *txt; phase analysis
All functions of these instruments are retained after DISS installation. The external DISS5 electronics generate the X and Y deflection voltages, digitise the analog image signals (SE, BSE, CL), and/or count the pulses of an EDX or WDX system to produce element distribution images or concentration profiles.
The digitized images can be edited, annotated, measured, printed, and saved.